A record breaking day for the start of the week as the Philippines passes its new record high and into the 8,000 realm with 8,019 new cases today.
No country has ever had a second surge that ended well. Particularly those from developing nations. This will be a long drawn battle for the nation as the national Ro approaches 2.0. That’s national and not NCR alone. NCR hits an all time high of Ro of more than 2.0. Which is alarming and scary.
This new record high continues to push the active cases as there are now more than 80,000 active cases (12.1 percent). I would like to remind readers that these numbers are based only on those that are tested, recorded and monitored. It does not include those who have signs and symptoms or asymptomatic who have not been tested at all.
The speed of the trajectory now pushes the total cases to more than 671,000 and if we continue this trend in the next few days, we will definitely see more than 700,000 before the week comes to a close.
This is not far from impossible considering the positivity rate has stayed at 15 percent for the past days.
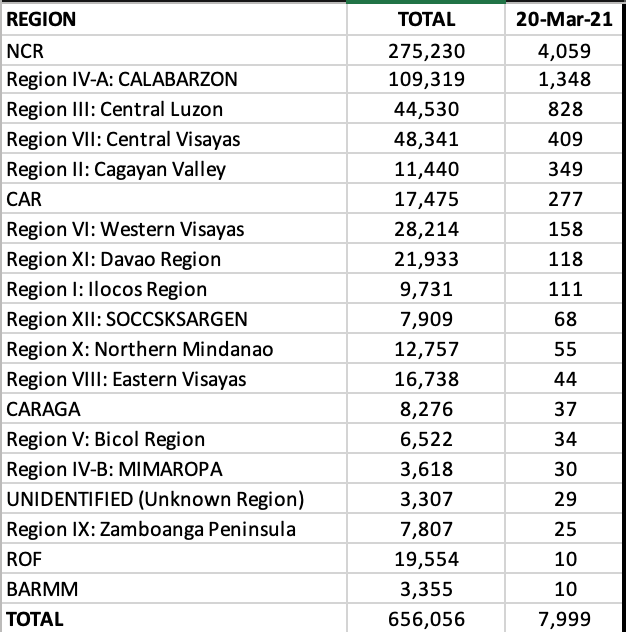
The National Capital Region continued to rake in more than 50 percent of the total cases with 4,103 (51.2 percent) of the cases today. In second was CALABARZON with 1,327 new cases (17 percent). The other provinces with triple digits were: Central Luzon (542), Central Visayas (487), CAR (424), Cagayan Valley (272), Western Visayas (225), and Ilocos Region (120).
In the NCR, Quezon City continued to account for the highest cases with almost 1,000 cases today. This was followed by Manila with 587, Taguig with 375, Makati with 341, Caloocan with 264, Paranaque with 209, and Pasay City with 208 cases. The cities of Malabon, Las Piñas, Pasig, Valenzuela, and Marikina registered more than 100 new cases each. Fifteen of the 17 cities in NCR were in the top twenty cities and municipalities today.
On a provincial level, all provinces in the top ten had triple digits with Cavite leading the pack. Three provinces registered more than 400 new cases each. They were Cavite, Cebu and Rizal.
Of the 81 provinces in the Philippines, only 8 (or less than 10 percent) reported no cases of COVID19 for the day. They were: Surigao del Sur, Eastern Samar, Basilan, Camiguin, Siquijor, Tawi-Tawi, Batanes, Dinagat Islands and Davao Occidental. Batanes has the least COVID-19 cases in the country with just 4 cases since the pandemic began.
For the week of March 14-20, 2021, the Philippines added 39,438 new cases in those 7 days.
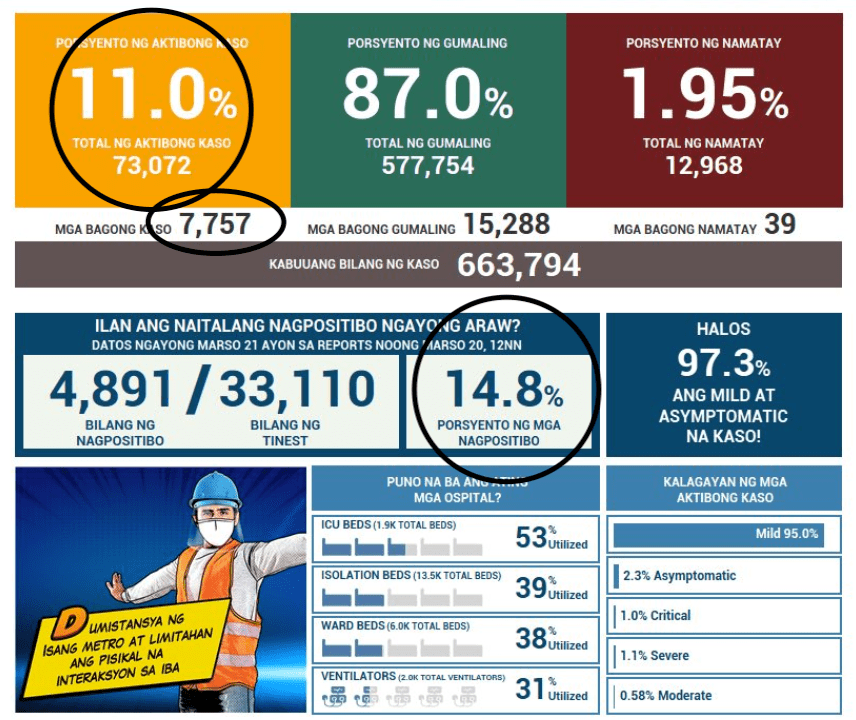
Today the Health Agency reports 7,757 new cases and 39 new deaths. In spite of the weekend recovery haul of more than 15,000 cases, it wasn’t enough to bring down the active cases which now hovers at 11 percent with more than 73,000 active patients. Remember, as the number of cases continue to increase, the number of active cases will take time to decline. Putting the population at higher risk for transmission of the virus.
The daily positivity rate remains unchanged at 14.8 percent (close to 15 percent), implying that for every 1,000 individuals that get tested, around 150 will turn up positive.
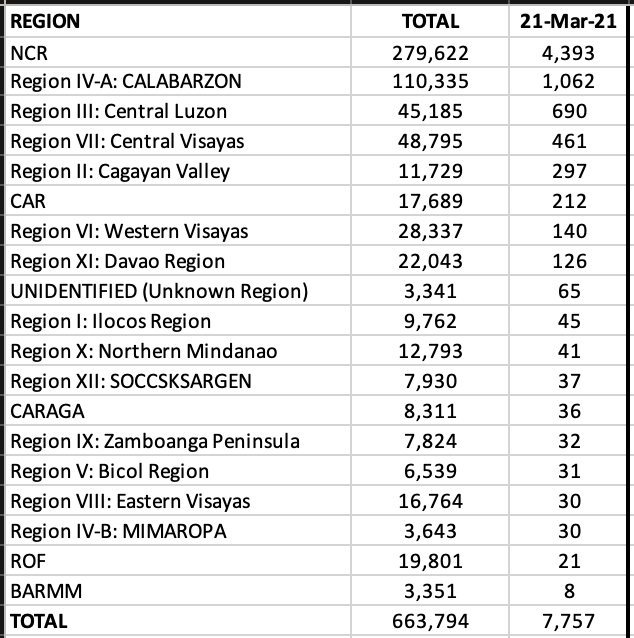
The National Capital Region continued to lead the haul with 4,393 new cases or 57 percent of the total cases for today. CALABARZON is in second with 14 percent contribution and Central Luzon with 9 percent. These three regions continue to account for 80 percent of the total cases in the country. The other regions with triple digits today were: Central Visayas, Cagayan Valley, CAR, Western Visayas and Davao Region. Twenty-one ROFs were included in todays tally.
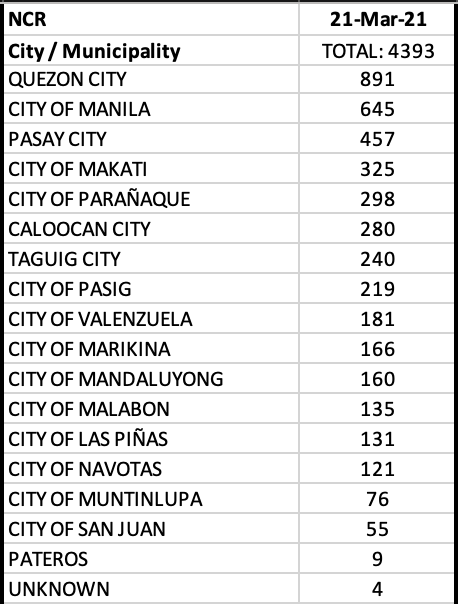
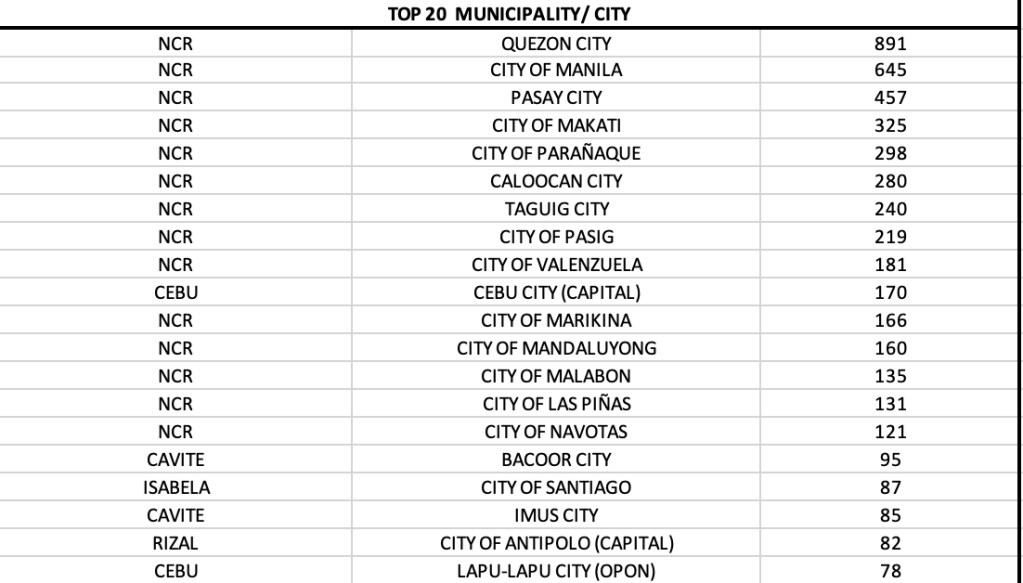
In Mega Manila alone, 14 of 17 LGUs reported triple digits! Making this one of the worst days in the NCR. Quezon City continued the haul with 20.3 percent of the total cases, followed by City of Manila with 645, Pasay City 457, Makati 325, Parañaque 298, Caloocan 280, Taguig 240, and Pasig 219. The cities of Valenzuela, Marikina, Mandaluyong, Malabon, Las Piñas and Navotas all reported more than 100 cases. All 14 of the 17 LGUs that reported triple digits landed in the top twenty cities with most cases.
On a provincial level, Cebu was back on top. But the provinces of Bulacan, Cavite, Rizal, and Isabela are seeing higher numbers today. Nueva Ecija, for the first time, lands in the top ten.
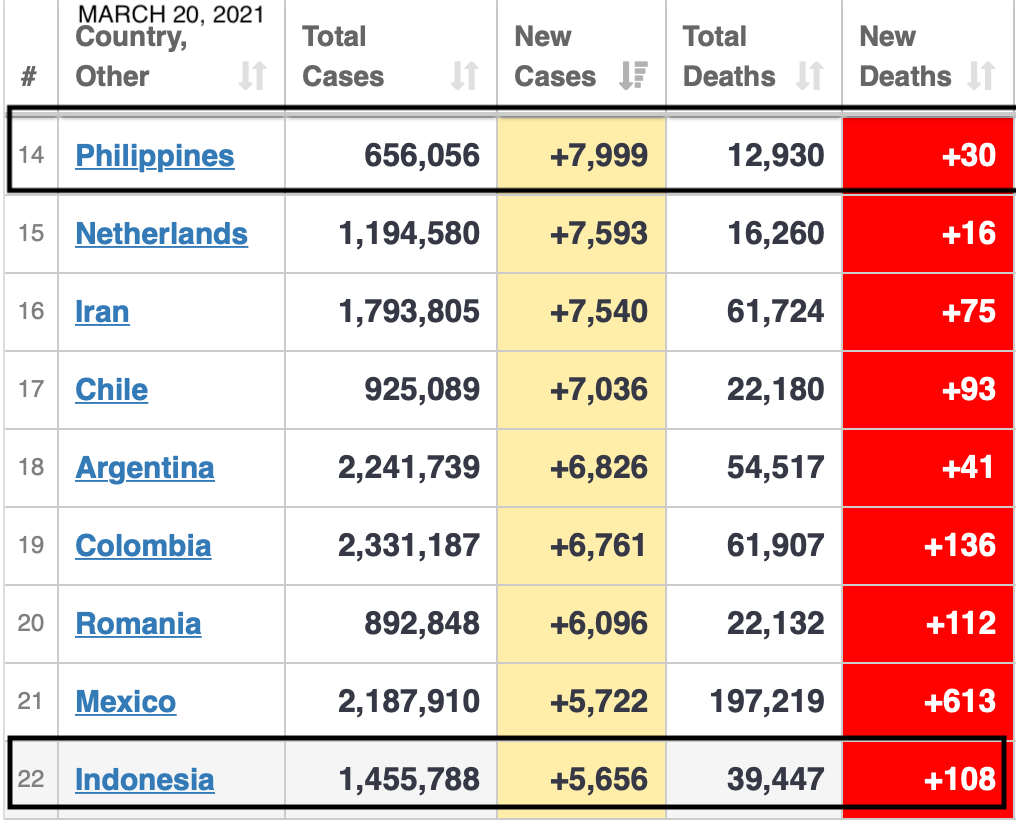
Yesterday, March 20, 2021 was a game changer with the 7,999 cases reported in a single day. The Philippines ranked 14th in total number of new cases, overtaking several European and South American nations, including our Asian neighbor Indonesia.
Based on the European CDC tracking, only the Philippines is seeing a significant surge of cases in the region. This is the highest surge the country is experiencing since our initial surge between July – August of 2020. The surge in the Philippines is mainly driven by the National Capital Region, which contributes to more than 50 percent of the daily numbers, CALABARZON (Region IVA) with more than 16 percent, and Central Luzon (Region III) with more than 10 percent.
The OCTA Research group had predicted that the mathematical probability of being in the 8,000 range is highly likely to occur considering that the positivity rate averages 15 percent daily for the past few days. The Philippines is now tracking a higher positivity rate as a nation at 8 percent on the average. In short, it was inevitable that the 8,000 mark would be reached or breached. With rising daily positivity rates and a large active cases pool, today marks the highest number of new cases reported in the Philippines. And the numbers are expected to rise in the upcoming days and weeks.
In todays report, the Health Agency announced 7,999 new cases, 30 new deaths, and 597 new recoveries (which will really not matter considering that the active cases are now more than 80,000 and will continue to swell disproportionately).
With a 14.6 percent positivity rate, we will continue to report cases in the range of 7,500-8,500 the next few days, depending on the extent of tests done.
Of the 7,999 new cases today (which should really be more than 8,000 because 6 laboratories did not submit data), the granular data continued to show the NCR being the epicenter of the pandemic in the country with more than half the cases today (4.059) coming from Mega Manila alone.
Notice the difference in the graph of the Health Agency below (as of March 18, 2021). The first surge last year took us an average of 7 weeks to climb. The highest peak was during the week of August 6-12, 2020. And it took us more than 10 weeks to stabilize the weekly new cases. CALABARZON’s share is now up at 17 percent with 1,348 new cases followed by Central Luzon with 828 (10.4 percent). These three regions that are contiguous with one another account for more than three-fourths of the total cases in the country.
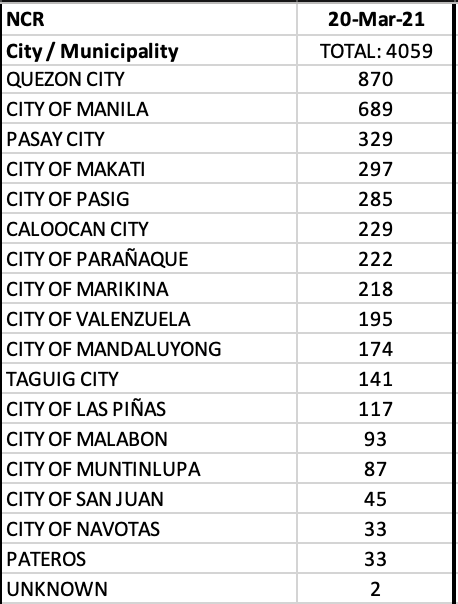
In the NCR alone, all LGUs showed a significant rise in daily cases with Quezon City contributing to almost 900 cases or 21.4 percent of the cases in Mega Manila. The City of Manila had 689 and Pasay City had 329 new cases. The cities of Makati, Pasig, Caloocan, Parañaque, Marikina had more than 200 cases, while the cities of Valenzuela, Mandaluyong, Taguig and Las Piñas reported more than 100 cases. Fourteen of the 17 LGUs in NCR were in the top twenty cities with most cases in the country today.
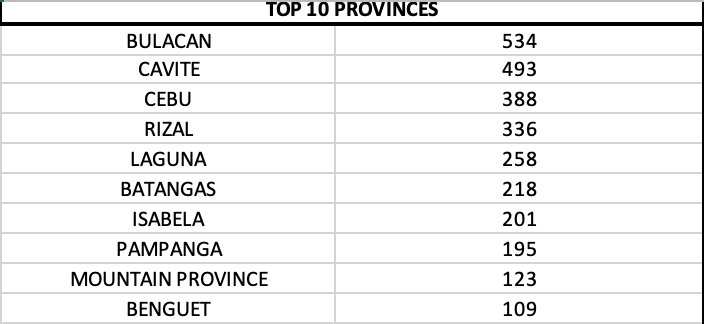
A new record for the top 10 provinces was marked today when all ten provinces reported triple digits or more than 100 cases each. Bulacan led with 534, followed by Cavite with 493 new cases.
The second surge is markedly different inthat it took us only 2 weeks to reach numbers this high. The incline is steep. And a steep incline is indicative that we have not even peaked yet. With the current trend, we will need to exercise more restraint when deciding to go out for nonessential matters.
Let’s start with today’s data release from the Health Agency.
The most number of cases since the pandemic began in the Philippines marks a milestone with 7,103 new cases announced today. This puts the total number of cases close to 650,000 as the second surge dramatically changes the landscape of the pandemic at a time when the economy is tattered and vaccines are still in the waiting list.
Here’s what the reader needs to focus on:
The number of active cases has ballooned to 11.3 percent (more than 73,000 active). Remember, it takes two weeks to even consider these cases as “recovered” using a time-based endpoint. As more cases accumulate, the number of active cases will continue to balloon. Meaning more potentially infectious people circulating.
The percent of positive patients being tested are at an all time high – 15 percent! This is based on more than 35,000 being tested. On the premise that it is the same positivity at 50,000 people tested, that would mean around 7,500 new cases tomorrow.
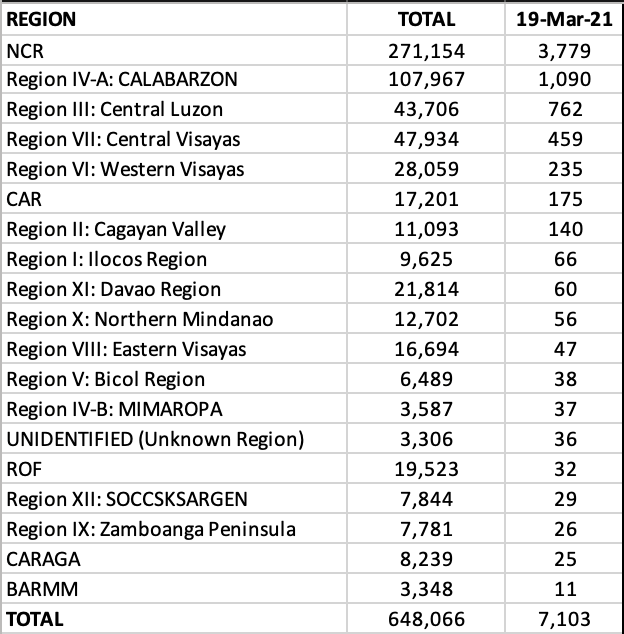
On a granular level, NCR accounted for more than 53 percent of the total cases with 3,779 new cases. CALABARZON reported 1,090 (15.3 percent) followed by Central Luzon, Central Visayas, Western Visayas, CAR and Cagayan Valley.
Among the 17 LGUs in NCR, Quezon City led with 752 new cases or 20 percent of the total cases in Mega Manila. Manila, Makati, Caloocan, Pasig, Pasay, Taguig, Parañaque had more than 200 cases. Marikina, Mandaluyong, and Valenzuela had less than 200 but more than 100 new cases. 14 of 17 LGUs in NCR were among the top ten cities with most cases today.
On a provincial level, Bulacan led with 439 new cases. Eight of the top ten provinces reported triple digits.
The post for the last few days had one take home message – this surge is real.
The indirect message is that, if we don’t this surge seriously, it will end up ugly.
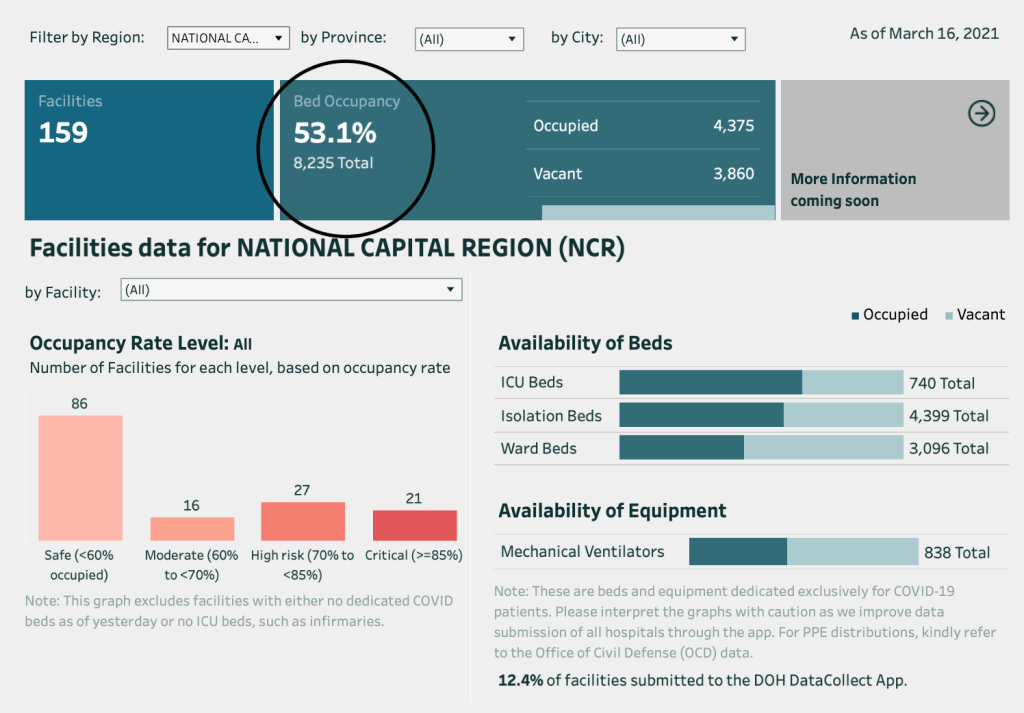
In the March 17, 2021 Philippine COVID-19 Update of the OCTA Research Group, NCR alone continued the upward trend in numbers and accounted for more than 50 percent of the total daily cases in the country. The reproduction number is up at Rt = 1.96, its highest since May 2020. With a daily attack rate of 15.9 per 100,000 population over the past 7 days, the region is now classified as high risk. The positivity rate for tests is at an all time high at 12 percent, with testing in the NCR up by 18 percent to almost 25,000 tests daily. The hospital bed occupancy for COVID19 patients in the NCR is at 49 percent, with ICU occupancy for COVID19 patients at 64 percent based on data from the Health Agency.
The top 25 LGUs in the country with the most number of new COVID19 cases over the past week (March 10-16) showed very high attack rates (>20/day/100,000) in Pasay City, Makati, Navotas and Santiago, Isabela. As a matter of fact, Santiago, Isabela had a 24,300 percent (twenty four thousand three hundred percent) change in new cases over that period.
While the province of Cebu still has relatively high numbers, it has significantly slowed down and its major LGUs like Cebu City, Mandaue, and Lapu Lapu have seen a drop in new cases and attack rate as well.
Those that are shaded in yellow are seeing significant increases and are alarming, while those in orange hue have very significant numbers depending on the parameter (e.g., change in new cases or daily attack rate or hospital occupancy).
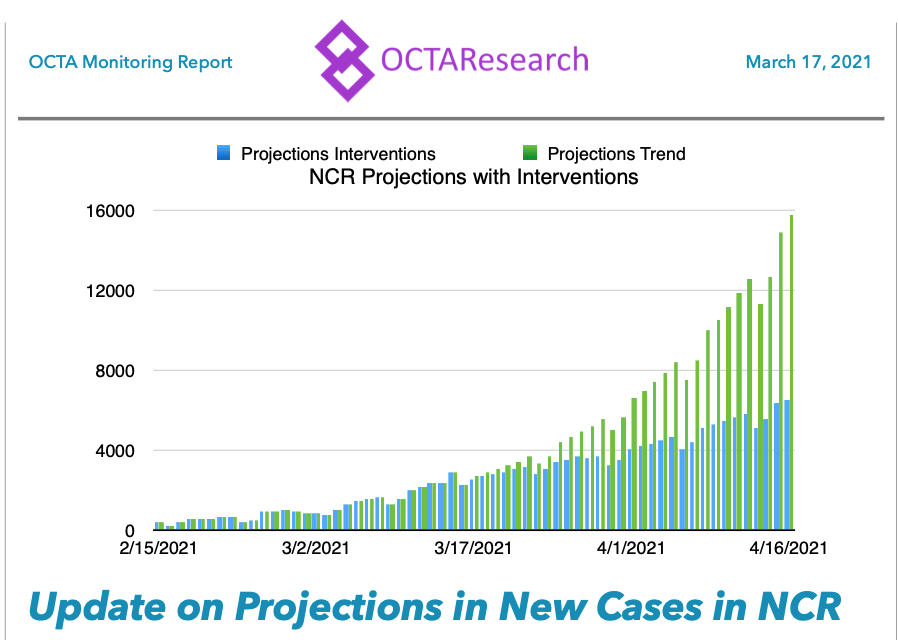
“…by simulating the combined effects of localized lockdowns, curfews and stricter implementation of health protocols…the projection compares Rt=2.0 (trends currently observed in NCR continue or if city ordinances and interventions have zero effect on the trend). The result is that more optimistic scenario can reduce the number of new COVID19 cases by the end of March to less than 4,000, compared with 7,500 if there are no changes (i.e., if the current trends of Rt=2.0 persist).
By mid-April the model that takes into consideration the city ordinances could lead to 6,000 new cases, compared to 16,000 if current trends continue.
Localized lockdowns may work against variant-driven surges but they are more effective in tandem with expanded testing, contact tracing and supported isolation. Localized lockdowns are also more effective when communities support them. Hence, LGUs organizing lockdowns must ensure that they are humane and protective of individual rights, and that the communities affected must be provided food, water and other minimum basic needs.
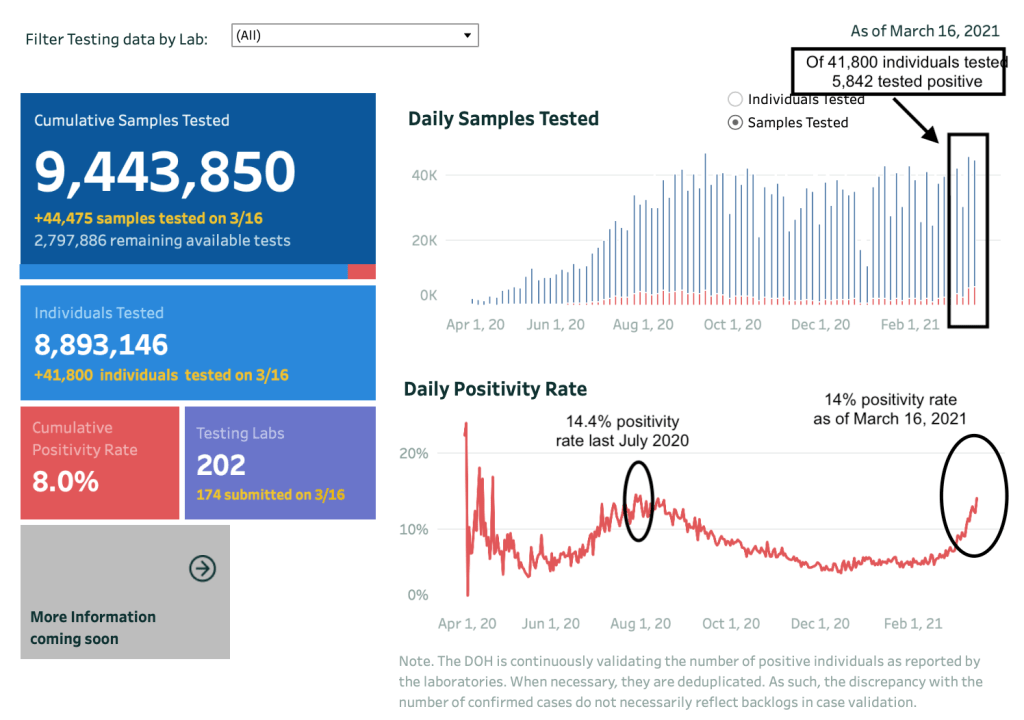
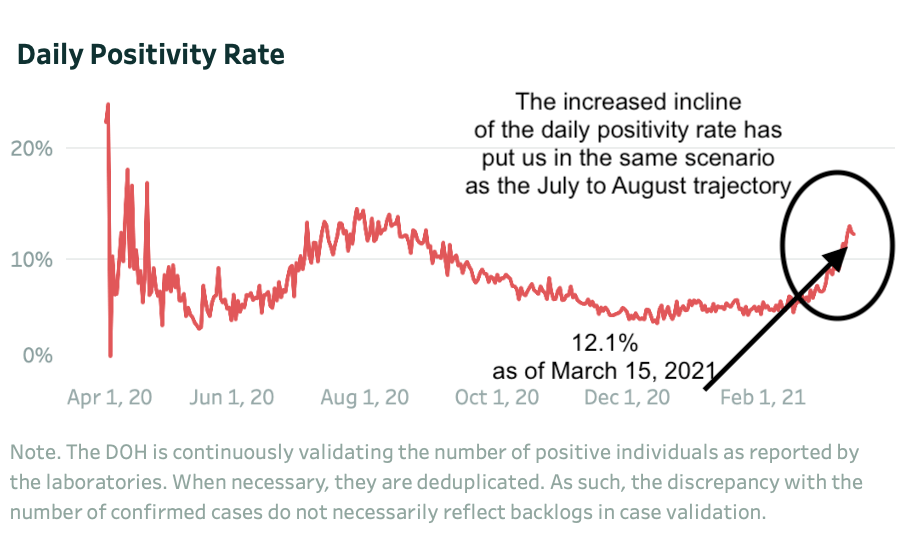
The daily positivity rate for March 16, 2021 was almost similar to the July 30, 2020 trend. The difference? We’re running 10,000-15,000 more samples for testing in this surge compared to the last surge. Which implies that we need to be testing more. And with more than 220 testing centers now compared to the 150 testing centers last July 2020, there is no reason that we shouldn’t be testing more and doing more aggressive contact tracing.
That is why we are where we are today with the numbers.
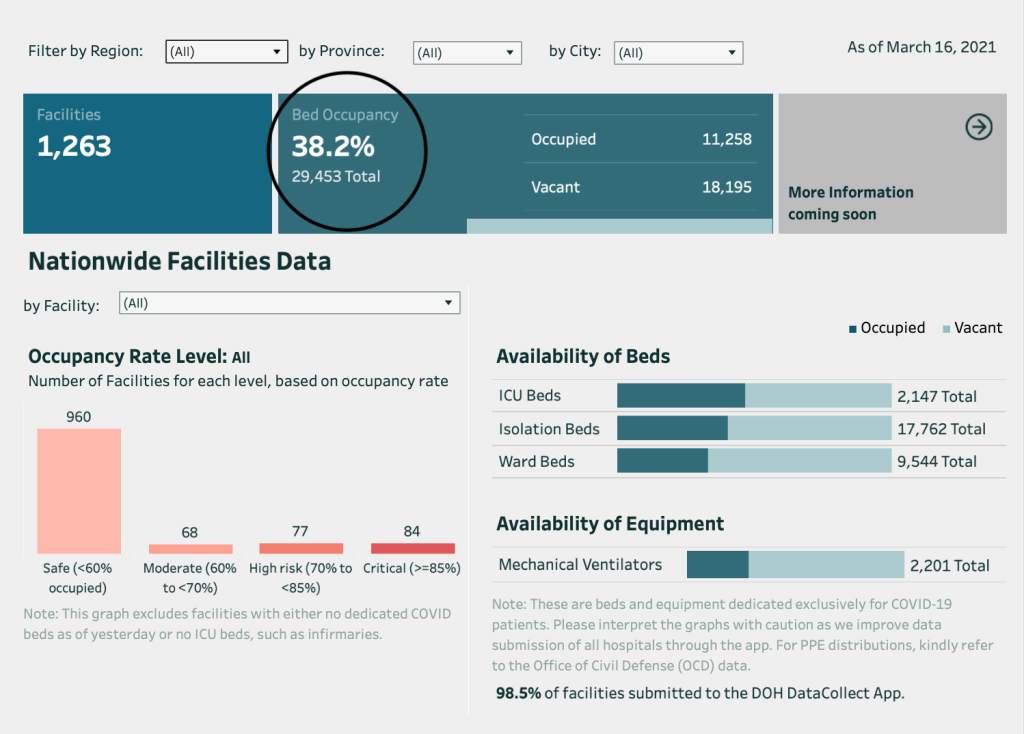
The Health Agency notes in the website (and in their press release) that the hospital capacity of the country is still way below the critical level. This, however, is not an accurate picture of how the pandemic playbook is affecting health systems in areas with higher cases. There are over 1,260 facilities spread throughout the 7,640 islands of the country. Only five regions are currently inundated with cases, with NCR seeing quadruple digits daily.
Health capacity dramatically changes when you drill down to the specific regions. In the National Capital Region where the daily cases far exceed the daily cases of other countries, the occupancy rate is past 53%.
This National Capital Region, or Mega Manila, is divided into four districts.
District 1 is the city of Manila only, where around 1.8 million reside in a land area of 42.88 sq. km.
District 2 covers the Eastern Manila District, where the LGUs of Mandaluyong, Marikina, Pasig, Quezon City and San Juan are found. District 2 has the highest population with 4.7 million people over a 236.4 sq. km. area.
District 3, otherwise known as CAMANAVA, cover the cities of Caloocan, Malabon, Navotas and Valenzuela. They have a population of close to 3 million on a land area of 126.42 sq. km.
District 4 or the Southern District comprise the cities of Las Piñas, Makati, Muntinlupa, Parañaque, Pasay, Pateros and Taguig. The population for this district is around 3.7 million occupying a land area of 208.28 sq. km.
The Health Capacity of the various districts also vary. The 1st district has a hospital occupancy of 47.3 percent, the 2nd district at 51.2 percent, the 3rd district at 48.1 percent and the 4th district is the most overwhelmed at 68.6 percent.
Today, the Health Agency reports 5,290 new cases bringing the total cases past 640,000. Thee were 21 new deaths reported today.
The highlights of the day are encircled:
(1) The active cases have surpassed 10 percent with more than 66,000 active.
(2) The positivity rate is at 14.1 percent with 5,635 positives from close to 40,000 individuals tested.
Of the 5,290 cases today, 2,767 (52.3%) were from NCR alone.
CALABARZON reported 917, Region VII, 473, Central Luzon 413, Cagayan Valley 159, Western Visayas 107.
In NCR, Quezon City reported 539 new cases (19.5%) of the total. The others? Manila 490, Pasay City 227, Makati 223, Marikina 211, Pasig 192, Parañaque 172, Caloocan 152, Taguig 132, Mandaluyong 113, Valenzuela 101. The remaining 6 LGUs in NCR had double digits but still increasing numbers.
The Health Agency’s website today shows the steep incline in cases for the week March 4-10, 2021. This, in spite of the fact that the data is based on Date of Onset of Illness. Definitely, this storm is far from over and as the vaccine program of the government is being rolled out to the frontliners, the government needs to seriously consider placing containment policies on mobility in the next few weeks in order to avert this surge.
Testing showed the proportional increase in daily positive rate with the increase in cases. Not testing enough and not doing enough contact tracing as more patients are being seen much later on when the clinical symptoms are already present.
The Health Agency reports 4,387 new cases today. A bit lower than yesterday but expected for a Tuesday and Wednesday announcement.
Encircled below are the important numbers and parameters.
Number of active cases will exceed 10 percent tomorrow. It is now at 9.7 percent with more than 61,000 active cases.
The positivity rate for March 16 (as of 12 NN) is up at 14.1 percent, our highest since July of last year. Will we breach the 6,000 mark tomorrow? Not a far possibility.
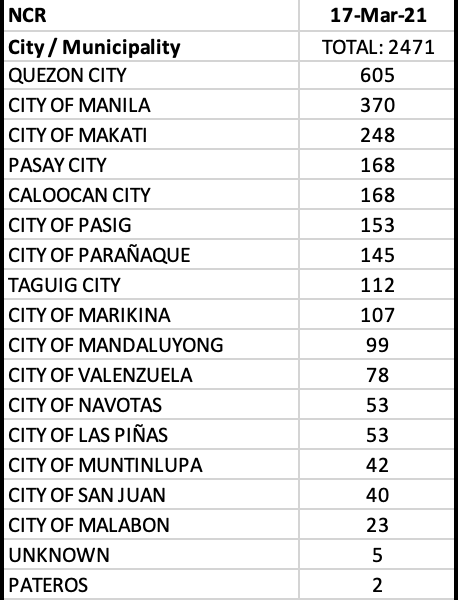
NCR continued to account for the majority of cases with 2,471 or 56.3 percent for the day. Five other regions reported triple digits – CALABARZON, Central Luzon, Central Visayas, Cagayan Valley and CAR. Note the significant decline of cases in Central Visayas on a regional, provincial and city level. There were 28 cases with unknown residences from a regional level.
In the NCR, Quezon City continued to lead with 605 or almost 1/4 of the total cases in Mega Manila. The city of Manila, Makati, Pasay City, Caloocan, Pasig, Parañaque, Taguig, and Marikina reported triple digits today.
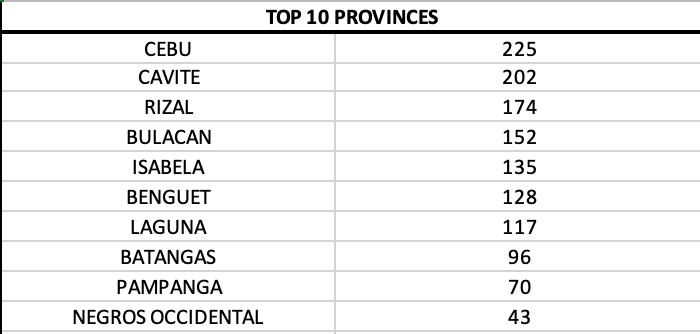
On a provincial level, Cebu was back on top but with significantly lower cases. Cavite, Rizal, Bulacan, Isabela, Benguet, and Laguna reported triple digits.
Fifteen of 17 LGUs (88 percent) in the NCR filled the top 20 cities and municipalities with most cases. An indication that the surge is highly concentrated in Mega Manila. Top 11 cities with most cases today were all from NCR.
With the increase in positivity rate and the high number of positives as of 12NN today, we will definitely see a significant rise in cases tomorrow. This means that if 50,000 tests were done at 14% positivity rate, we may be testing the 7,000 level within the week.
If this were a TV series, the first season of the pandemic could be described aptly as one helluva rollercoaster ride. And in the same vein as many season endings, yesterday’s 5,404 new cases left us in a climax where the data clearly showed how formidable the virus is.
While many countries had to deal with similar, if not more tragic outcomes in spite of better resources, other nations showed that they were able to step up to the challenge in conquering the pandemic against all odds. For some countries, a change in leadership was necessary to pave the way for addressing correctly in managing the ongoing pandemic in their own territories. The inevitable changes led to better outcomes as worthier leaders took the helm.
If there was one lesson that resonated from the season 1 of the pandemic, it was clear that science played a crucial role at driving the right direction on how a pandemic is managed. How each nation grappled with the pandemic depended heavily on the extent to which its leaders acknowledged the gaps and failures. Without a doubt, every disaster requires a risk management system. But systems are not cast in stone. And disaster preparedness is one that should be ‘forward looking’, using the lessons of the past in order to capacitate itself in order to avert another disaster or if and when it is inevitable, we now have more leg room to manage it because we had foresight.
So we give Caesar what is due Caesar.
We thank the many “czars” for the job done. The tasks given to each was herculean in itself. At the end of the day, there is no playbook on how to survive a pandemic. Some of them, however, could have done a better job had they been better qualified for the task. The defense mechanism(s) of people who are there to defend the faux pas of the government’s less sterling moments is terribly wanting. If there is something we learn in disaster management, it is realizing that gaps exist, gaps are acknowledged and that solutions at addressing them should be provided. Humility, is, after all a virtue lacking in many.
In much the same way as there is no instructional manual on how to manage pandemics, there is nothing written about how economies of various scale can pull through a pandemic without significant losses. Some industries may end up more profitable than others because of the nature of their business. Resilience and innovation tested the various businesses as the world saw the economy grovel to its knees. And the small and medium enterprises were the first to be buried.
The pandemic started at various timelines depending on the country. While some escaped it unscathed, others were left with having to replay the horror, sometimes more than once. We are at that precipice.
The star of 2020 was without a doubt, science.
The speed with how drugs, vaccines, diagnostic modalities and other medical devices were discovered was the silver lining that kept the candle of hope burning through the darkest days last year.
The second season begins on a brighter and more expectant note with these discoveries in science and medicine.
It is what will pull us through the next season of the pandemic.
Let us hope that this will be a short season, and this season finale should have a happy ending.
Like all stories, only we, as a people can write how this story ends.
On Tuesdays and Wednesdays, the Health Agency usually reports slightly lower numbers than the previous days. That’s because the data that is reported is actually two days late. As in other parts of the world, where we get lower numbers on weekends, the Philippines reports its lowest number of cases on Tuesdays (and a tad higher the day after). The actual numbers come in on Wednesdays to Mondays, reflective of that two days lag.
It is also interesting that only the Philippines uses the “date of onset of illness” in capturing cases. Which is odd because majority of the cases do not and cannot pinpoint the date of onset of illness.
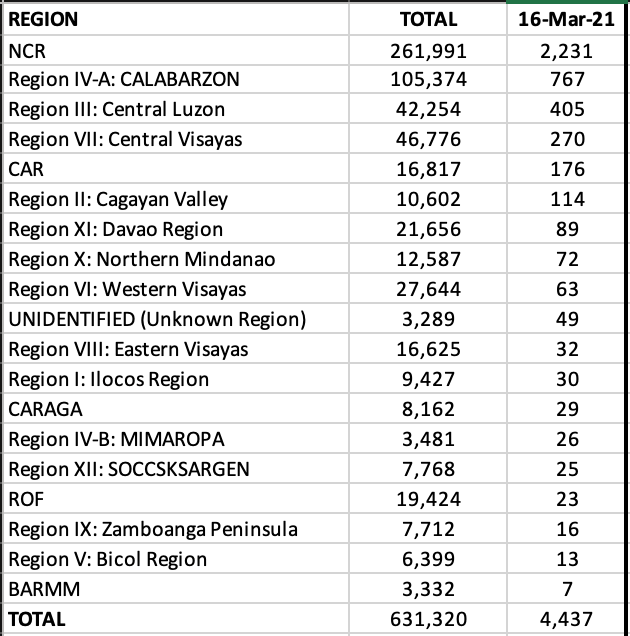
Today, the Health Agency reports 4,437 new cases, 11 new deaths and 166 new recoveries.
The stark revelation here is the number of active cases which has climbed to over 57,000 (and continues to climb). In addition the positivity rate for tests remains over 10 percent (11.2 %). With the Ro in the NCR now at 2.03, unless drastic measures are implemented we may actually defy the high numbers we saw last July-August 2020.
With today’s case load, the NCR continued to lead with 2,231 new cases (more than 50%) in spite of the lower total cases for the day. Five other regions recorded triple digits: CALABARZON, Central Luzon, Central Visayas, CAR and Cagayan Valley. Remarkably, Central Visayas moves down to fourth spot after almost two months in second rank.
Eight LGUs in the NCR had triple digits with Quezon City reporting more than 20 percent of the total cases. Manila, Makati, Pasay City, Taguig, Parañaque, Caloocan and Pasig had more than 100 cases each. Fourteen of the 17 LGUs were in the top twenty cities for the country. Of the top ten cities with most cases in the country today, ALL were from Mega Manila.
The province of Cebu for the first time moves down to fourth place in rank on a provincial level. The provinces of Rizal, Bulacan and Cavite now outrank Cebu.
Every country that experienced a surge had one common story. It was worse and more difficult to manage.
Alllocal data are information downloaded from the Data Drop of the Philippine Department of Health. The author does not own any of the information except the analysis of all data. Global data are referenced properly from Worldometers.info, Ourworldindata.org (European CDC), World Health Organization (who.int), and the New York Times. Where appropriate, additional information may be culled from other references or health agencies.
UPDATED MARCH 15, 2021
Sadly the daily grind is real. As we commemorate a year of various struggles and quarantine measures, a formidable enemy called SARS-CoV2 has managed to upend lives. The way we live, breath, and move is not normal.
I would like to thank everyone who has journeyed with me throughout the various lockdown measures of the government as it attempted to battle the virus gallantly. One year later, I will give the first round to the virus. Our numbers show it. True we have learned bitter lessons and come out of round one knowing where the virus can be attacked in round two. The question is, are we more prepared for a virus that has also come back prepared in the second season of the pandemic?
Summary for the day
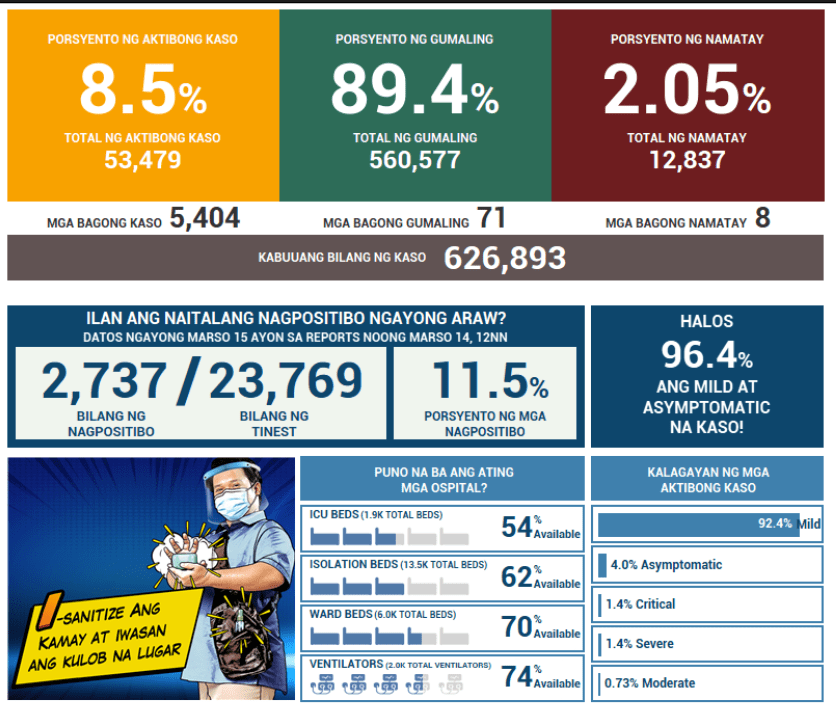
The week opened with 5,404 new cases, driving the total cases now to 626,893. Note that the active cases are now past 8.3 percent or more than 53,000 individuals remain active (or infective).
There are 8 new deaths reported today, bringing the case fatality rate to 2.05 percent.
As usual the National Capital Region led the haul with close to 3,000 (2,842 or 53 percent) of todays cases. Six other regions with triple digits were: CALABARZON, Central Visayas, Central Luzon, CAR, Western Visayas and Cagayan Valley. These 7 regions alone accounted for 89 percent of the total cases.
The number of ROFs (returning overseas foreign workers) with new cases is up at 31.
There are 34 new cases that have no location identified even on a regional level. It’s the same problem all over again when we experienced the first surge where many unknowns were being reported.
Quezon City is seeing a dramatic rise in cases as it records 655 new cases today or almost 1/4 of the total cases of Mega Manila. Eleven LGUs in NCR reporting triple digits aside from Quezon City, were: Manila, Pasig, Taguig, Makati, Pasay, Caloocan, Malabon, Parañaque, Marikina and Mandaluyong.
Fourteen of 17 LGUs in NCR were in the top twenty cities with most cases. The top seven cities with most cases in the country were all from Mega Manila.
While Cebu province still had the most cases on a provincial level, the dramatic turn is on three provinces in the CALABARZON area that is seeing unprecedented increase in cases. They are: Cavite, Rizal and Laguna. The provinces of Bulacan and Pampanga lead the haul for Central Luzon.
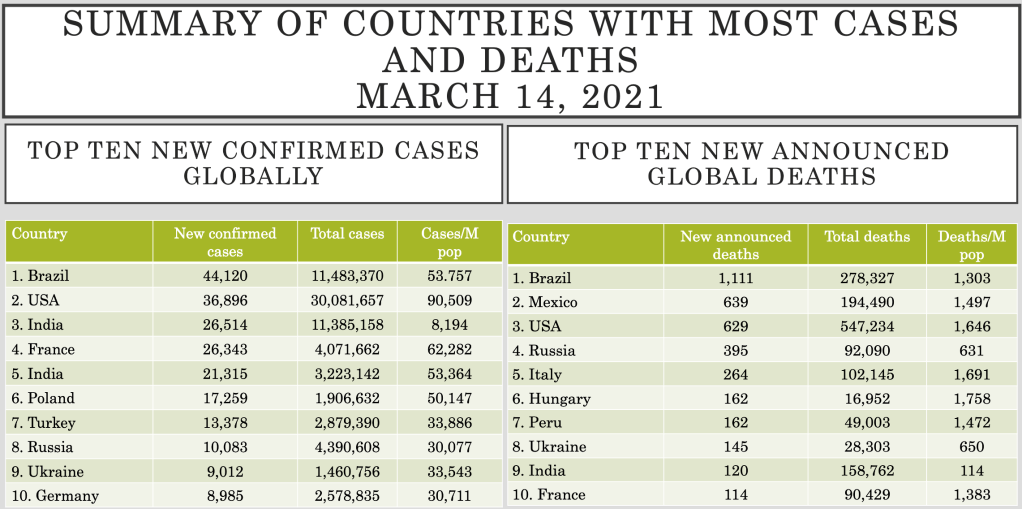
The World (March 14, 2021)
With 363,965 new cases added yesterday (lower because of the weekend), the world will simmer at the 120 M mark for another day or two before crossing the next million, as the number of global continues continue to remain steady at around 380,000 new daily cases.
5,724 new deaths bring the global case fatality rate down to 2.21 percent.
The United States of America officially now has 30 million COVID-19 cases, while Brazil continued to dominate the most number of new cases and new deaths globally.
With pandemic fatigue affecting not only the economy but our mental and physical health, it is not a surprise many are looking forward to vaccines as the saving grace.
At first, I thought writing an article on coronavirus vaccines was a bit premature considering the fact that while the speed of biologicals development has far exceeded our expectation, media and press releases have jumped the gun in the race to vaccine development and in the process may have missed out on some information that is up for discussion before deciding to join a clinical trial, get a vaccine when available and other issues that some of us may not have even thought about.
So let’s look at some facts and questions you probably didn’t consider asking (or were afraid to ask).
The New York Times Vaccine Tracker provides a simple overview of how many and what vaccines are in the various phases of development. It also summarizes what that phase of development entails. For example, phase 1 of drug development looks at safety and dosage. While the objectives of the various phases have specific objectives, the over-arching goal in any drug development process is SAFETY.
The regulatory spectrum ranges from phase I to approval status, with some drugs being approved on a limited basis early on. There can also be a combination of these various phases in order to accelerate the drug development process for emergency use.
As of November 29, 2020, there are six vaccines that are approved in some countries under limited use. All are either manufactured in China or Russia, with China, Russia, and the United Arab Emirates using these vaccines on a limited basis.
2. Are they effective?
All studies will still need to go through a peer review before it is published by a reputable journal. So far, the data on efficacy is limited to media releases by the developers of the vaccine.
But what does effectivity (or efficacy for that matter) mean?
The term efficacy is used in controlled clinical trials. Effectiveness is measured when the general population is using the product already. In short, until the drug/biological is in the market, we will not know its effectiveness. Hence, efficacy is not the same as effectiveness.
A clinical trial is not a real-world setting. Subjects are included based on inclusion and exclusion criteria, which are most likely stringent. For example, children who may not be initial targets for COVID19 vaccines will be the last to be studied. Currently, only China’s Sinovac COVID19 vaccine is doing phase III clinical trials in children.
Effectiveness cannot be measured in controlled trials, because the very act of including non-real world scenarios distort the usual practice of a clinical trial.
In the real world – can patients who have had coronavirus infection receive the vaccine? To rephrase the same question, this time emphasizing on safety issue, can patients who have had coronavirus infection or are positive for SARS-CoV2 safely receive COVID vaccines?
ADE (ADE) or antibody dependent enhancement phenomenon is a real world phenomenon that can pose safety issues on a long-term basis.
3. Safety and ADE
Short term safety concerns have been addressed by many of the manufacturers. Most of them were anywhere from mild to moderate reactions.
Some vaccine trials have come to a pause. It is not uncommon to encounter pauses during clinical trials. When investigators find worrying symptoms, they try to determine if it is related to the drug, place the trial on pause, and investigate the case. Two outcomes result after an investigation – the trial is resumed or abandoned. If the adverse event in the trial paused due to highly concerning safety issues, (remember it is still in a clinical trial phase) that means that safety issues in a few when extrapolated to a larger population can be dangerous.
Which goes back to the concept of ADEs. In ADE, cross-reactive antibodies generated by a previous exposure to a heterologous strain are believed to facilitate the within-host replication of a second invading strain. This phenomenon has been seen in Dengue, HIV, and a variety of flaviviruses and other viruses.
We need to remember that it has been barely a year since the pandemic started. The race to drug and vaccine discovery is even much shorter. Which brings us to the issue on long-term side effects – a possibility – that can only be evaluated years after the vaccine is in the market.
So if one has had SARS-CoV2, was asymptomatic, had never been tested, believes he never had the viral infection, could he safely receive the vaccine? Remember, it is possible that because almost 10 percent of people who are tested have no symptoms at all and yet turn up positive on RT-PCR testing, you may have had the virus but did not know you had it. If this is a real world scenario, then it is likely too that ADE may be a potential issue with vaccine safety.
Clinical trials have not yet begun in children and pregnant women and other immunocompromised groups. Whatever recommendations there will be when the vaccines are launched will be for healthy human subjects who were negative to the coronavirus from the get go.
4. Herd Immunity
Best laid plans for immunization programs is aimed at achieving herd immunity.
Otherwise called “community immunity”, herd immunity is achieved when enough people are immune when transmission of the disease is reduced or eliminated. Herd immunity is achieved by protecting people from a virus, NOT by exposing them to it.
The concept of immune response to COVID19 is still unclear. The percentage of people that need to have antibodies to achieve herd immunity for coronavirus is not yet fully understood as the virus manifests anywhere from asymptomatic to severe disease in those affected. Other questions left unanswered are, among those who do develop antibodies, how long do these antibodies last, and we know now that there are patients who can get reinfected. Is the severity of disease correlated with the amount of antibodies produced and the protection against getting COVID19 in the future? If you’ve had COVID19, does that exempt you from getting the vaccine? Or if and when you get the vaccine this time around, is it safe?
Following the same trend of thought, if you do get immunized, will you need boosters in the future and how frequent should you get it?
Based on mathematical modeling, if the vaccine is found to be at least say, 70 efficacious, you may need to provide immunization to at least 60-75 percent of the population at risk.
No vaccine is 100 percent effective. Sadly, that’s a fact. People respond to vaccines in various degrees. And even with antibody responses, some patients have antibodies that wane quicker than others over a period of time.
Which makes us return to the concept of “effectiveness”.
If a vaccine is touted to be say, 70 percent effective, what does that imply? Effectiveness estimates how much of the disease will drop in vaccinated people on the presumption that the rate of infection among people who do not get vaccinated is 1. In layman’s terms, it means that 70 percent of the people who developed COVID19 without being vaccinated would not have gotten it had they been vaccinated.
With these unknowns, it is still not reassuring that if one gets vaccinated, one will NOT get COVID19 (as in any other vaccines, there is no 100 percent assurance). If one does get COVID19 in spite of getting the vaccine, will it be mild or can the disease progress to severe/critical and can one still die from COVID19 in spite of having received the vaccine?
If one does get an infection even when one is immunized, is that person contagious? (I am definitely sure that the person is and will still have to follow all the quarantine and mitigation measures that we’re currently practicing.)
The 2-3 million doses that the government and private sector are planning to purchase will probably not make a significant dent on how the pandemic is playing out in the Philippines. With a population of 110,000,000 spread over 7,630 islands in this archipelago, even targeting the most highly dense populations will not be enough to curtail community transmission.
The concept of herd immunity teaches us, that in order to make sure that we nip the transmission in the bud, then a large percentage of the population need to get immunized now (and not spread out over a 2-3 years period) – so that if say 70% of those immunized don’t get sick, then the remaining 30% who are not immunized will not get sick by default.
5. Interchangeability
Because there are many candidate vaccines out there, one needs to remember that they come in different “platforms”. These so-called platforms serve as the delivery systems for the body’s immune response to a foreign substance, in this case, SARS-CoV2.
This is being discussed on the light of interchangeability.
In short, if the patient receives a vaccine with a mRNA platform (synthetic messenger RNA), can he receive the second dose with a vaccine with an inactived virus platform?
Vaccines from similar platforms (e.g., mRNA) MAY theoretically be interchangeable. However, adjuvants and other substances added to the vaccine in order to improve the deliverability or immunogenicity may not be the same.
For now, as a general rule, because of lack of interchangeability studies, one cannot and should not even consider purchasing multiple source vaccines for immunization programs. Not only will it impact on the effectiveness of the vaccine but safety issues can be a nightmare to health authorities and regulators when several options are cascaded at the get go.
6. Cold Chain and Storage
Finally, one needs to consider preserving the integrity of the vaccine.
Cold chain refers to temperature-controlled supply chain. The delivery of vaccines to every part of the world, every region, every province, city, town, municipality and barangay is a complex undertaking.
That chain is a series of coordinated linked events related to preservation of the ideal temperature from manufacturing to storage, management and transport until the time of administration to the patient or recipient. Disrupting that chain is disastrous because the integrity of the vaccine becomes compromised. For example, if the vaccine will require -80 degrees C storage capacity, one will need to know how long it can be thawed and what appropriate timing from thawing to administration to patient is best so as not to affect the potency of the vaccine.
The most common problem encountered with vaccines when not stored properly is a decline in the potency. Which virtually leads anywhere from minimal to no protection at all, giving patients a false sense of security, increasing the risk to developing disease, and increasing the risk of disease to others in the community because of failed immunization.
As more information eventually unfolds in the future on COVID19 vaccines, recommendations will change. Answers will be provided.
For now, patience is a virtue. And we have no recourse but to make sure that we contain the pandemic, the old fashioned way.
It is a term used in economics and statistics to mean PER PERSON.
While it is most commonly used when comparing an economic metric to a population (like GDP and income per capita), it can be useful for all forms of statistical analysis that will require comparing metrics with varying population numbers.
Per capita information provides more granular data than just aggregate information. By using per capita, data is translated as being able to compare apples to apples between countries with different population sizes.
Yes. I’m referring to the coronavirus pandemic.
Worldometers, Johns Hopkins, the European Center for Disease Control, the World Health Organization, the New York Times and many other organizations and agencies rank the countries based on the total number of cases instead of per capita.
It’s interesting what the data looks like when we use per capita as the basis for mapping out cases and deaths in the pandemic.
To illustrate, we look at the cases and deaths due to COVID19 since the start of the pandemic in top 12 Asian countries.
Based on population, China has the highest number of people with over 1.4B, followed by Indonesia, Japan, the Philippines and Vietnam. The country with the smallest population in the region is Brunei with less than half a million people.
While Indonesia may have the highest number of cases to date (followed by the Philippines), based on population size, Singapore has the most number of cases per capita by a mile. Note that although it only reports close to 58,000 cases, it has less than 6M people in the nation giving them 9,873 cases per million population. China has more than 85,000 reported cases, but with more than 1.4B people, based on per capita, the country has around 60 cases/M population.
The same story can be told in deaths due to COVID19.
Indonesia has the most deaths in this part of the world – if we were just looking at total number of deaths. When the population is taken as a factor, based on per capita, the Philippines has the highest death rate due to COVID19 with 59 deaths/million population. China, that reported 4,362 deaths so far is all the way down in number 9 with a per capita or 3 deaths/million people.
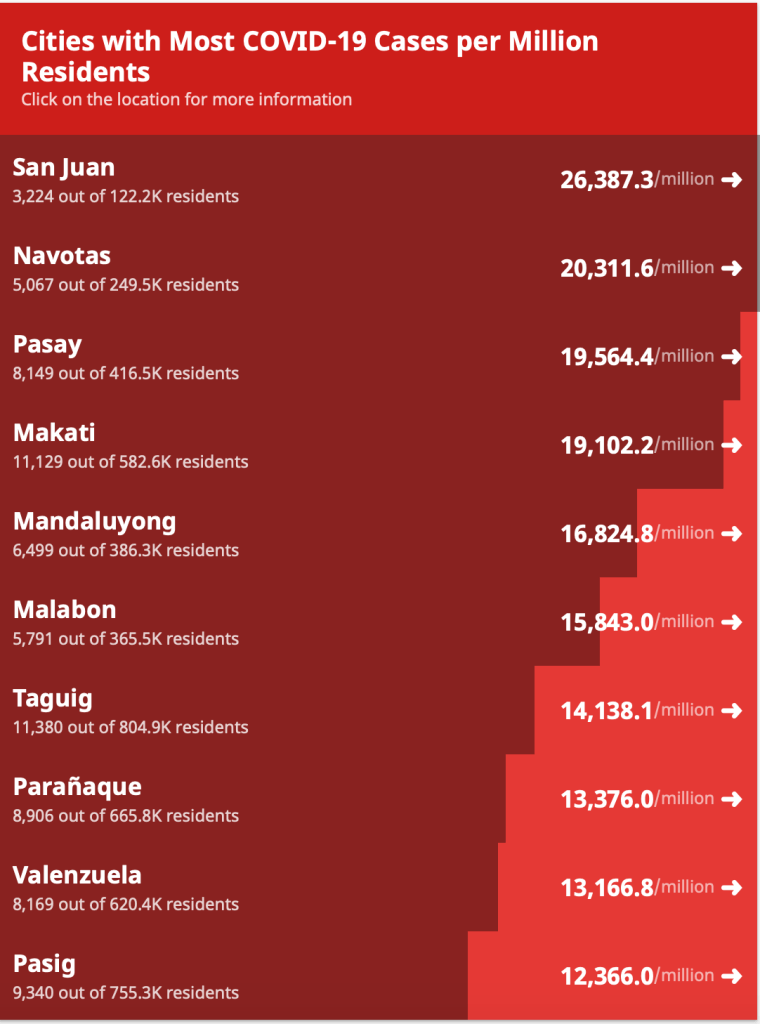
In the same manner, when looking at local epidemiological data, notice how the Health Agency (and this blog) reports. Presentation of data is based on number of cases either by region or by city. It’s always easier to understand data if it is based on numerals easy for the general public to absorb.
If the above tables are rearranged according to per capita as shown in the table below, people will never understand why a city like San Juan that has only 3,224 cases is at the top of the list in cities with most coronavirus cases per million residents. The public don’t understand (or even know) that San Juan has only 122,200 registered residents making their per capita 26,397/million people. Notice that Quezon City and the city of Manila, while at numbers 1 and 2, respectively in the daily case count are not even in the top ten cities.
That’s because while Quezon City has more than 31,000 cases in its pocket, with a population of close to 3,000,000, its per capita is only 10,819/million population. The same story is seen in the City of Manila where in spite of the more than 21,000 cases to date, its population of almost 1.8M people make their per capita 12,000/million population.
Why then is data reported in terms of number of cases and deaths rather than per capita?
Countable running values (using addition and subtraction) are easiest to understand from a layman’s point of view. It also provides better information on control of transmission of the infection because values provided per capita are difficult to translate when it comes to control of infection in a particular locality. One cannot use per capita to determine whether various measures in the control of the pandemic are effective or not.
But the per capita perspective provides a clearer perspective on which countries are, or are not doing better in the pandemic.
The illustration below from the European CDC shows that the darker the hue of the blue color is, the more cumulative confirmed cases PER MILLION people there are in that particular country.
This next figure below shows the daily new confirmed COVID-19 cases per million population – another way of reporting per capita data. Here, there are two hues. One orange and the other purple. As the color approaches a more purple hue, then there are more cases being reported from that particular country.
On the perspective of having to compare apples versus apples, the per capita approach provides more accurate information.
Which means the Philippines leads overall in deaths in Southeast Asia, while Singapore leads in cases.